How does it work?
On this server you can use the latest version of RIBER/DIBER to predict your crystal contents (nucleic acid only, protein only, protein-nucleic acid complex).
Uploading a dataset and running a job
The server requires a file in MTZ format
(used in CCP4) or uncompressed CIF
format (files used by the PDB to store experimental data).
The file should contain the measured
amplitudes or intensities and corresponding
standard deviations measured up to at least 3.0 Å resolutuion.
Your file will NOT be stored on this server.
After uploading a dataset you must specify if a crystallization solution
contained RNA or DNA. Depending on your choice RIBER or DIBER will be used
for calculations.
You can use one of two modes of the server: standalone (RIBER and DIBER)
or combined (DIBER only). In standalone mode prediction is prepared based
on the cube root of the reciprocal unit cell volume of a crystal and the largest
local average of reflection intensities in a thin resolution shell.
The prediction prepared in combined mode is
enhanced with the PHASER Maximum Likelihood Fast Rotation Function score and is more reliable.
However, PHASER is subject to third-party constraints and it is your responsibility
that you comply with any such restrictions. Please contact the
PHASER
developers to obtain the necessary permissions for
academic and commercial use.
Listing jobs
The server gathers information about past jobs of registered users (dataset details and a prediction). To see job details click on the corresponding file name in the list. Anonymous users may acces their prediction with a unique link.
Job details
Apart from a standard, plain text prediction DIBER and RIBER prepare a pie chart presenting estimated probabilities that your crystal belongs to a given class (nucleic acid only, pure protein, protein-nucleic acid complex). You can also download a PostScript file containing some extra information (see below).
PostScript output description
The graphical output available in a PostScript file depends on the program mode.
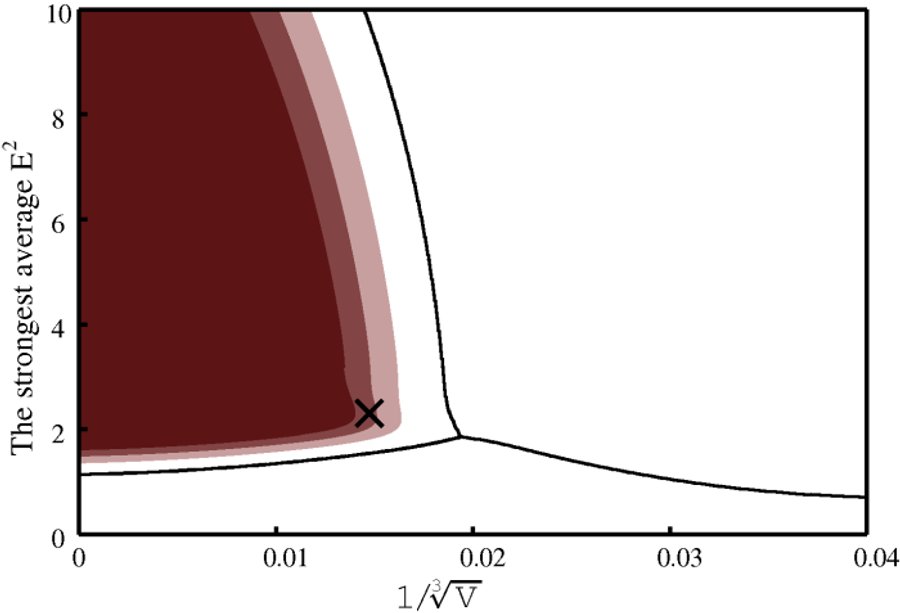
Standalone mode
Two graphs are produced. One presents the feature space with the classification boundaries and regions of high level of correct classification probability.
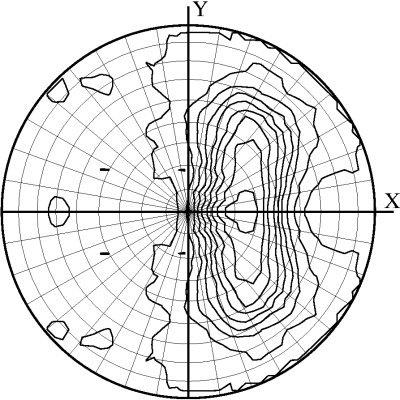
As a by-product of the classification, the program outputs a plot of the local intensity averages on a stereographic net. If a nucleic acid present in your crystal displays long, regular helices their orientations in the unit cell may be derived from the postion of strong signals on the projection.
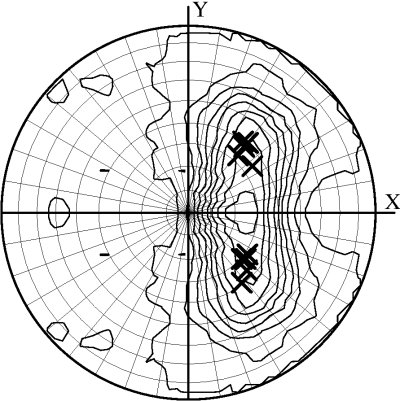
Combined mode (DIBER only)
In this mode, the feature space becomes three-dimensional and thus is not graphically presented. Instead, the top ten solutions of the PHASER rotation function are marked on the stereographic net along with the contour plot of the local intensity averages.